
Moving average is one of the fundamental and essential tools in technical analysis. Among other things, you can use moving averages to determine which trend is in a market, whether it’s upward, downward or moving sideways.
| At eToro you can trade 49 currency pairs, including several cryptocurrencies. Join eToro |
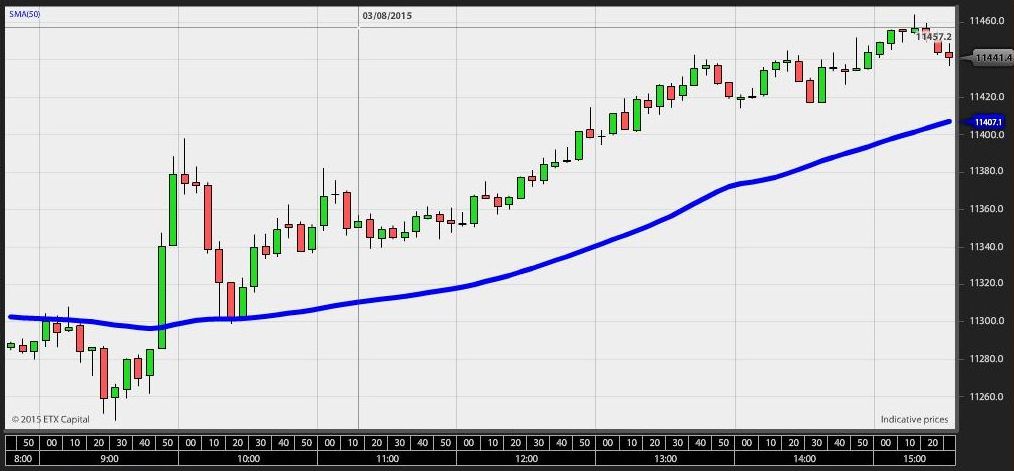
Looking at a moving average over the last 50 periods, you have a long perspective for a day trader. If you use a long-term moving average, the short-term fluctuations disappear and you have a picture of the overall movement of the market. With a moving average of 50 periods on an hourly graph, the closing price is taken every hour over the last 50 periods and all the numbers are put together, after which you divide by 50. This is done every hour and the graph will show whether the moving average is ascending or descending.
Back in the day, you had to calculate it all yourself, but today it is calculated automatically on the various trading platforms. Below you can see how the moving average looks like. It gives a good and clear picture of the trend.
You can also use an exponentially moving average. The difference between a simple and exponential moving average is that the exponential moving average responds faster than the simple one. Try turning them both on, and see the difference.
Some day traders and investors use more than one moving average, one short and one long. The short moving average moves faster than the long, as it is based on fewer data points.
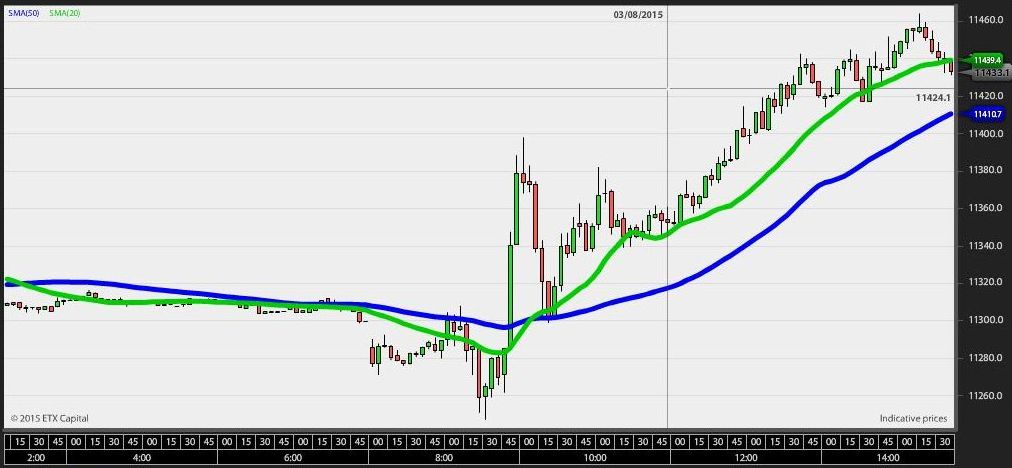
If the short moving average in a graph is below the long moving average, but suddenly breaks out from below, a so-called “Golden Cross” occurs. It is often seen as a sign that the market must be up, and can, therefore, be a buy signal.
Below is a picture of the German DAX, where a Golden Cross occurred shortly after the opening of the market at 9 o’clock. After this Golden Cross, the market moves upwards until it reaches a top, 160 points higher.
The reverse signal, when the short moving average breaks down and moves below the long moving average is called a “Death Cross”. It is perceived as a signal that the market is going down.
Daytraders can profit both when the market goes up and when it goes down.
| At eToro you can trade 49 currency pairs, including several cryptocurrencies. Join eToro |
For traders, there is no “magic” moving average values that are the right ones to use in order to get the correct signals. One should try and look at the graph, also back in time, and determine whether it serves as a good indicator. Many traders use time periods of 20, 50 and 200 as the basis for the moving average. But the smartest thing is to experiment with the values, and see how they fit when you look back at the graph – if the specific values would support some good buy and sell signals.