
It’s no secret that Bitcoin has reached all time highs in recent weeks. This year alone, there was a 120% increase in just over three months. This reflects, once again, that the world’s largest cryptocurrency may be one of this year’s best investments..
So the question is, should you sell your BTC now, or can the cryptocurrency reach even higher? And for those who haven’t bought it yet: is it too late to invest?
One of the best ways to analyze bitcoin is to look at the so-called on-chain data. There is an extremely large amount of information on the cryptocurrency market; buyers, sellers, holding times and much more. This makes it relatively easy to keep up with the market, contrary to what many may think.
This indicator can predict the peak
A key indicator in relation to predicting the peak is the so-called NUPL (Net Unrealized Profit/Loss) indicator, which was developed in 2019 by the data company Glassnode – a leader in blockchain analysis. The indicator shows how much unrealized profit the players in the market hold. Historically, it has been shown that the more profit there is in the market, the greater the risk that a large part of the market players will be tempted to take the profit home.
This is quite logical. At some point, so many people will have earned so much in Bitcoin that they will consider taking the winnings.
At this point, the Bitcoin market is entering a phase of euphoria, where the vast majority of market players have the opportunity to realize big gains. And it can give a strong downward spiral effect and set in motion a turnaround in the market – even though there are many enthusiasts who expect to keep their holdings for many years.
NUPL explained
NUPL is typically around 0. The lowest value observed so far was -1.8. In the most positive markets the value has been 0.8-0.85. A value above 0 indicates that the network as a whole is in profit. So if all bitcoins were sold today the value below 0 would indicate that the market as a whole is at a loss. The longer the NUPL value strays from 0, the closer the market gets to its bottoms or peaks. Very large profits in the network can set in motion a great deal of activity from salespeople in the market.
If you are interested in how exactly NUPL is calculated mathematically, you can check out this Glassnode article.
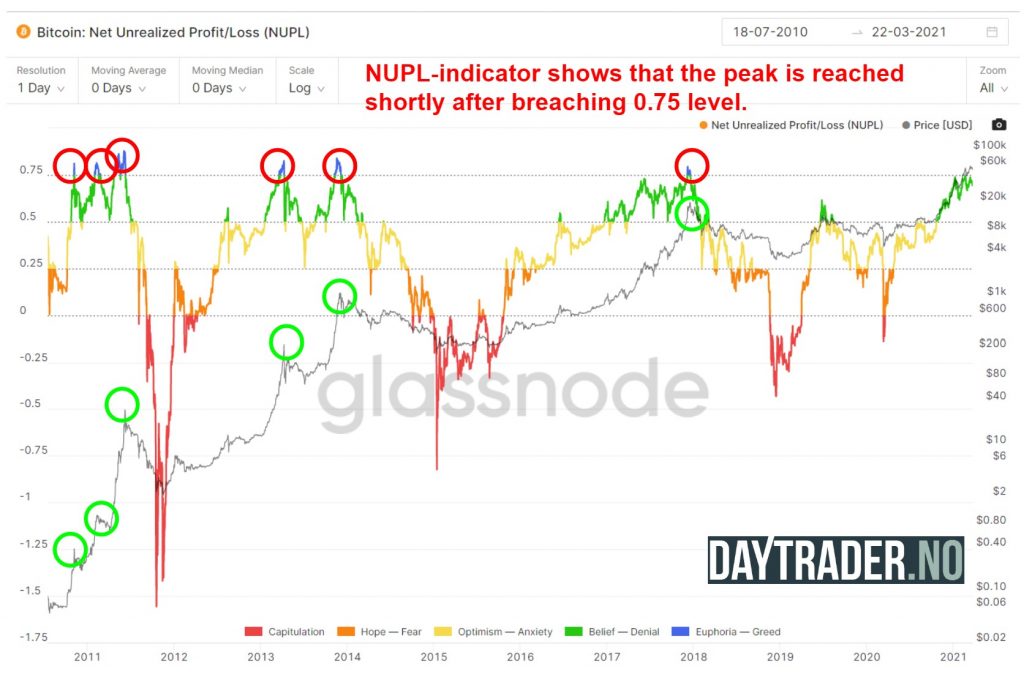
Historically, it has been shown that when the NUPL indicator gets above 0.75 and stays above this level for a certain period, then the price is very likely to peak soon. This has happened again and again throughout the history of Bitcoin and in this way it can be used as a warning light when the market hits what Glassnode refers to as a euphoria phase.
You can see the pattern in the picture below. The red circles in the graph show the points where the NUPL indicator goes above 0.75, and as you can see, this is synchronized with the price peaks, which are shown with the green circles. The graph can be enlarged by clicking on it.
The peaks typically occur a few days or weeks after the indicator gets above 0.75 and stays up there. One can e.g. see this at the latest major peak in 2017. Here, the signal came 10 days before the absolute peak in the BTC market. On December 6th, the indicator broke above 0.75 and the value remained above this level reaching up and round 0.79. This can be seen in the graph below (click to enlarge).
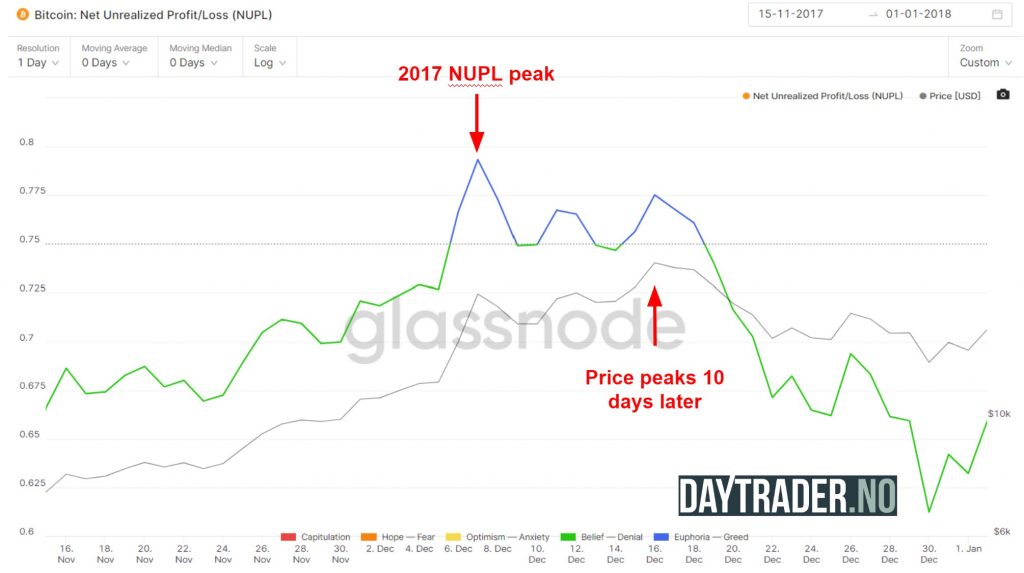
10 days later, the price reached its ATH at the time of close to $ 20,000 for a bitcoin. There are probably many who would have given a lot for having had this information in 2017, but now we can with some probability use it to predict the next peak.
It should also be noted that the price actually continued up 40% from the 6th of December and in the 10 days until the 16th of December. So the hype can well lead the market further upwards before it collapses.
Analysis of previous peaks
We have made an analysis of what has happened in connection with the largest peaks in the price that bitcoin has experienced throughout its history. Before all the greatest peaks, one sees the same pattern.
The indicator breaks above 0.75 and stays up there and the market then continues upwards for a short period and then it completely collapses.
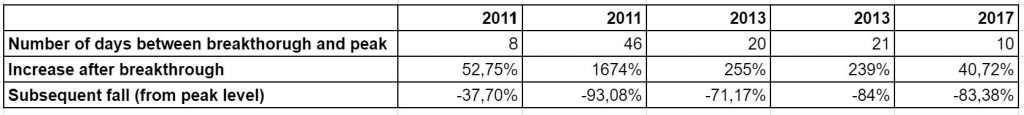
As the table shows, there have been 8-46 days between the critical level breaking and the price reaching its peak. At the same time, one can also see that the price has typically continued to rise in the last period after the break of 0.75.
In 2017, which is probably the best year to compare the current market with, the market increased by a further 41% after the break. And in the bottom row you can see that once the top is reached, the descent is very violent. Typically a decrease of 70-90%. Whether this will happen again can only be speculated, but if history repeats itself, as it tends to do, then it is worth noting how close we are to this possible turn.
Where is the market now?
The big question is, of course, where the market is now and how to trade with this knowledge. The picture below shows how the NUPL value has been this year. As you can see in the picture, in mid-February we were close to the hype level when the previous peak of $57,487 dollars was reached. At this point, the NUPL was at 0.749, and thus very close to the “magic limit”, where the market enters the last final sprint towards the top. In connection with the recent peaks, the indicator has not yet reached 0.75, but has been hovering around 0.70.
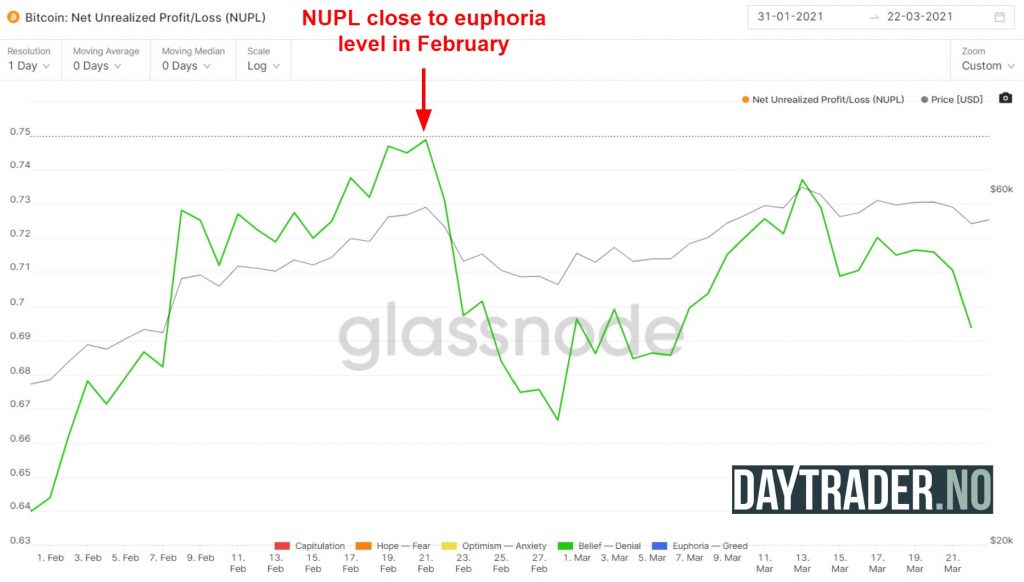
Since then, however, the value has fallen again and is now just around 0.70. This means that in the current phase of the bull market we are in a period where there is strong confidence in the cryptocurrency, but where we have not yet reached the final phase where euphoria and greed take over. That is, there is still room for increases.
If you are a long-term investor, you can choose to just hold bitcoin and ignore these ups and downs. If you have a slightly shorter time horizon, however, you should be aware of what is happening in the coming days, weeks, and months – the market can easily be pushed up into the euphoric phase with a subsequent rampage towards the bottom.
It may be positive for the price in the short run, but negative in the slightly longer term. For the time being, there is still a chance that bitcoin will move up rather than down, and new investors can therefore jump on the bandwagon based on this data, as long as they are aware of the possible swings that may occur in the coming days and weeks.