
Support and resistance levels are among the very basic concepts of trading, both long-term and short-term trading. Both levels are places on the graph where the price tends to stop and, in some cases, turn. Therefore, many people use them as potential points to buy or sell, especially if there are other indicators that the price should be reversed at this point.
| At eToro you can trade 49 currency pairs, including several cryptocurrencies. Join eToro |
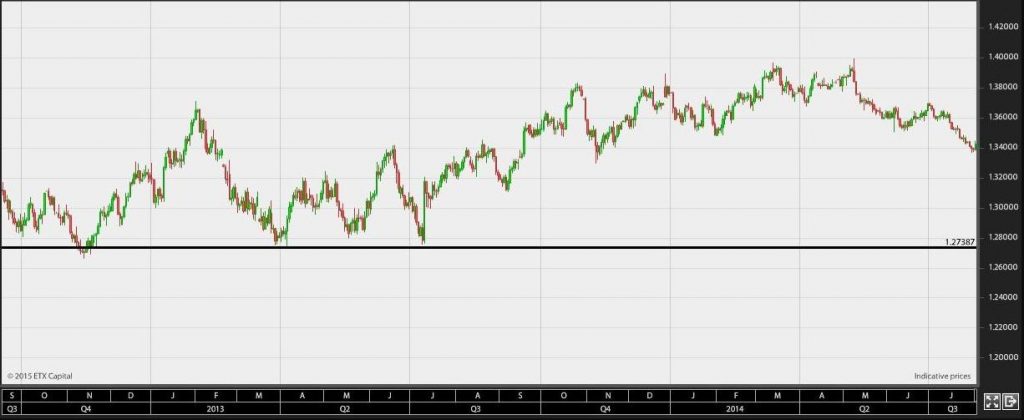
Below is an example of the euro-dollar price, where the price around 1.2738 serves as a support point and therefore becomes a buying opportunity for many traders.
These are a few successful traders, who use only support and resistance points to make their purchases and sales, but it serves many as a contributing factor when making important decisions. It should be noted that the more times a support or resistance point has been hit, the stronger it will be. Conversely, the price may break much further down when the resistance is finally broken.
Many beginner day traders are tempted to trade price breaks, for example, to go short immediately when a support point is broken. In most markets, this is a fairly risky strategy, as you often experience small fake breakouts, where a support level is broken shortly, but then reverses. You should, therefore, be careful about using this strategy.
Of course, resistance levels work in the same way, just with opposite signs. These are the levels that the price has encountered many times before, without being able to break through. Therefore, if you want to buy the market, you should be aware of whether there is a “ceiling” that the price bounces against, as it may make it less likely to complete the transaction successfully.
Another known phenomenon that relates to support and resistance is that support can often develop into resistance. An example of this can be seen below.
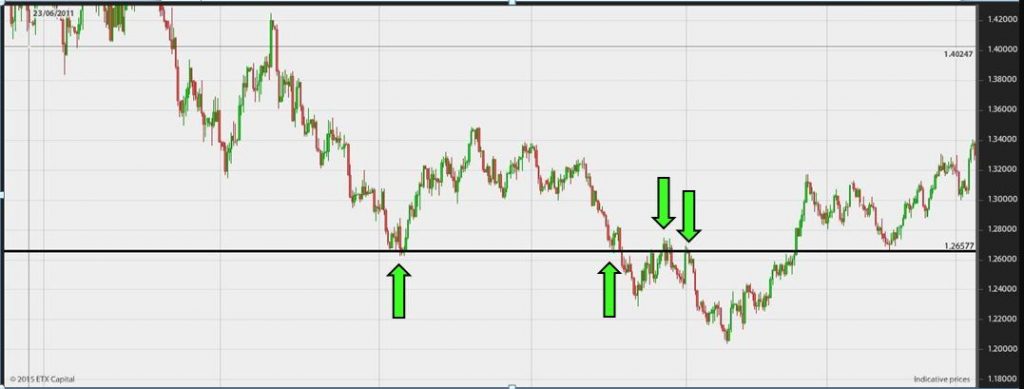
One of the explanations for this phenomenon is that when an established support point is broken, many traders short it, but not all traders make it in time. When the price then returns to the old level, it will be natural for the latecomers to short the market at that time.